

Most advice on contact center service level is too simple to be useful. It treats 80/20 like a law of physics, when it's really a benchmark that became standard because the industry kept using it, not because someone proved it was universally right Sprinklr on the 80/20 rule and ASA norms.
That matters because service level isn't a scoreboard metric. It's an operating decision. In collections, healthcare revenue cycle, insurance, financial services, government, and utilities, a missed call can create far more damage than a delayed sale. It can trigger compliance exposure, payment delays, escalations, repeat contacts, and preventable complaints tied to TCPA, HIPAA, PCI-DSS, FDCPA, or FCRA workflows.
A weak service level usually points to one of two problems. Staffing is wrong, or the contact path is inefficient. Sometimes it's both. Either way, leaders who treat service level as a vanity number tend to chase monthly averages while significant damage happens in the intervals where customers can't get through.
Teams that treat service level as a reporting trophy usually pay for it somewhere else. They pay in overtime, repeat contacts, complaints, abandoned calls, and in some industries, audit risk.
Service level is a measure of access. It answers a simple question with expensive consequences. When someone needs a live agent, can your operation pick up fast enough to keep the interaction on track?
That matters far beyond customer satisfaction. In collections, a delayed answer can mean a missed payment arrangement and a higher chance of another contact attempt later. In patient billing, it can leave a caller without clarity on coverage, balance, or next steps. In government, utilities, insurance, and financial services, poor access can create a paper trail of avoidable escalations and complaints that compliance and QA teams then have to sort out.
Leaders get into trouble when they inherit a service level target and never ask what it is protecting.
The familiar 80/20 benchmark is common because it gives operations teams a shared planning standard. It does not mean every queue should be staffed to the same threshold. A payments queue, a fraud line, and a benefits eligibility line do not carry the same cost of delay. If the risk of waiting is different, the target should be different too.
That is the part many teams skip. They chase the headline number and ignore the business consequence underneath it.
Practical rule: A service level target is only useful when it reflects the cost of making a customer wait.
Service level is one of the fastest ways to see whether the operation is built correctly.
A stable result usually points to a few basics working together:
When those pieces fail, service level often drops before other metrics get management attention. Then the downstream effects show up. More abandons. More repeat calls. Longer handle times because agents inherit frustrated callers. More exceptions for quality, privacy, and payment workflows.
That is why serious operators watch service level closely. It is not glamorous. It is an early warning that customer access, labor efficiency, and compliance exposure are starting to move in the wrong direction.
Service level calculation is simple. Reporting it accurately is where operations teams encounter difficulties.
Service level measures the share of inbound contacts answered within a defined time threshold. If the target is 80 percent in 20 seconds, the calculation asks one basic question: how many callers reached an agent inside 20 seconds, out of the total pool you chose to count?
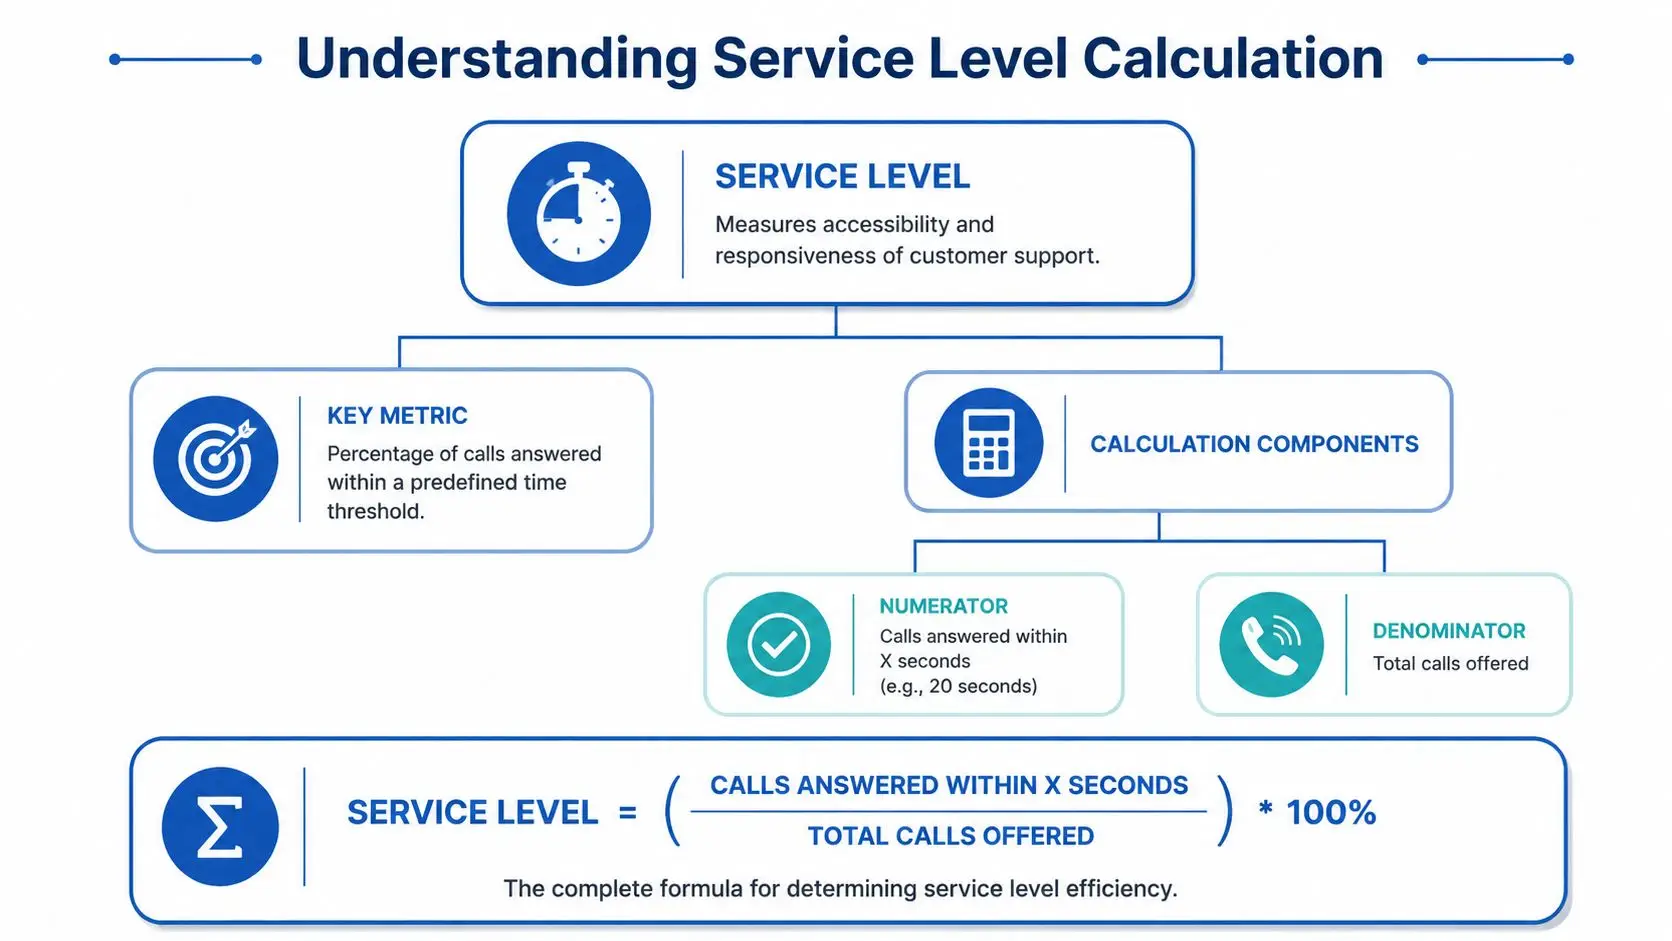
Service Level (%) = (Calls Answered Within Threshold ÷ Total Calls Offered) × 100
That is the baseline formula used across contact centers.
Here is a straightforward example. If the center receives 500 calls and 425 are answered within 20 seconds, service level is 85 percent.
The arithmetic is easy. The policy choices behind it are not.
In practice, the biggest argument is not over the numerator. It is over what belongs in the denominator.
Some reporting methods count only calls answered. That makes the number look cleaner, but it can hide a serious access problem. If callers abandon because the queue is moving too slowly, excluding them from the calculation flatters the operation and understates customer harm.
That matters more in regulated environments. A missed sales call is one problem. A delayed benefits inquiry, fraud alert, medication question, or collections dispute can create compliance exposure, rework, and audit issues. If the business treats those contacts as important enough to queue, the reporting logic should reflect what happened to them.
If a caller gave up before reaching an agent because the wait was too long, access failed. The report should show that failure.
You will usually see one of these methods in production reporting:
| Method | What it includes | What it hides or reveals |
|---|---|---|
| Basic service level | Calls answered within threshold divided by offered calls, with local rules on abandons | Easy to trend, but definitions vary from center to center |
| Strict service level | Treats abandoned calls as failures in the denominator | Gives a harder, more honest view of access |
| Adjusted service level | Excludes very short abandons based on a documented cutoff | Removes obvious misdials or immediate disconnects, but can be abused if the cutoff is too generous |
Short-abandon treatment needs discipline. Many centers exclude a few seconds to remove wrong numbers, carrier drops, or callers who disconnect before the IVR finishes. That can be reasonable. It becomes a credibility problem when the exclusion window keeps expanding until the report produces the result leadership wanted.
I have seen teams hit target on paper while the floor was drowning in callbacks, complaints, and escalations. The formula did not save them. Clean reporting would have exposed the staffing gap much earlier.
A service level figure is only useful if everyone calculates it the same way every time. Document these points and keep them fixed unless there is a formal change in policy:
That last point matters operationally. A center can post an acceptable daily result while failing badly in a few high-volume intervals. Customers experienced the interval failure, not the daily average.
For leadership reporting, use one primary formula and keep it stable. If you also publish an adjusted version, label it clearly and show the rule behind it. Do not switch methods month to month.
Service level should answer a plain operational question: did customers get through fast enough for the risk, cost, and compliance standard this contact type requires? If the calculation cannot answer that clearly, the issue is not math. It is governance.
A standard target is often a budgeting shortcut, not an operating truth. Teams inherit 80/20 because it is familiar, easy to explain, and easy to paste into an SLA. That does not make it right for every queue.
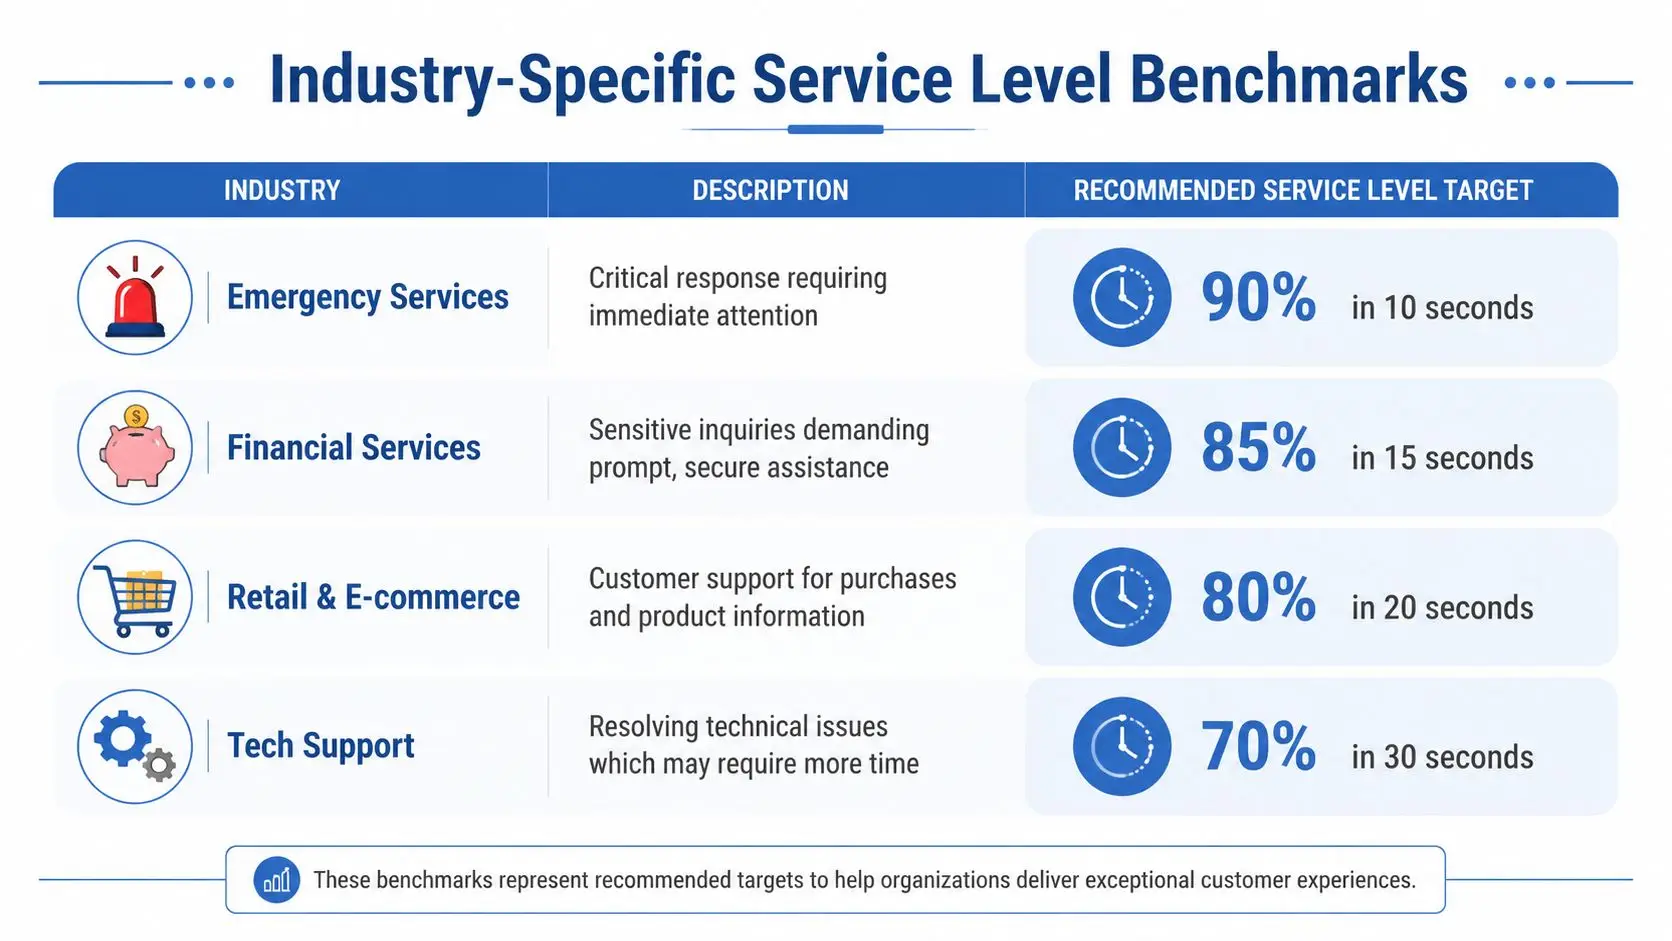
The target should reflect the consequence of delay. In a retail support queue, a slower answer may cost conversion or satisfaction. In a healthcare billing line, a missed call can trigger complaints, delayed payments, repeat volume, and avoidable compliance exposure. In utilities, benefits administration, collections, and public sector programs, the cost of getting service level wrong is often operational and regulatory before it is commercial.
That is why the 80/20 rule should be treated as a reference point, not a default. Some queues need faster answer times because the caller is trying to prevent a shutoff, resolve a dispute, make a payment under deadline, or respond to a legally sensitive notice. Other queues can absorb more delay without creating the same level of risk.
Set service level by queue purpose.
A disconnection queue should not share a target with general information. A collections line handling active payment intent should not be staffed like a reminder campaign. A healthcare contact path tied to claims, billing, or prior authorization has a different risk profile than a low-priority administrative line. Leaders who ignore those differences usually create two problems at once. They overspend on low-value accessibility in some places and underprotect high-risk queues in others.
Public sector standards often reflect that reality. Some government contact center programs publish answer-speed and abandonment expectations because accessibility affects service delivery and accountability, not just customer sentiment. Industry service frameworks also recommend judging service level by interval consistency instead of relying on a blended monthly result, because a monthly pass can still hide repeated failures during the busiest windows.
A single monthly target creates the wrong behavior. Operations teams can hit the average while failing during the hours that drive complaints, escalations, and repeat contacts.
A target band is more useful. It gives leadership a practical operating range while still exposing underperformance by interval, queue, and contact reason. If one period is overstaffed and another collapses, the surplus does not cancel the failure. Customers only experienced the wait they got.
That matters even more in regulated environments. If callers abandon while trying to make a payment, dispute an account action, or resolve a time-sensitive issue, the problem is not cosmetic. It can affect audit findings, downstream workload, and the defensibility of your operating model.
A service level target is credible only if it matches the risk of the contact and holds up during the intervals that matter.
Use a simple decision process:
The target should be defensible in plain language. If leadership cannot explain why a queue is set at a given threshold, what risk it is protecting against, and what failure looks like in operational terms, the number is not a strategy. It is a habit.
Service level improves when the center removes avoidable delay. Some of that work is operational. Some of it is technical. Most centers underperform because they only fix one side.

A center can't schedule its way out of a broken contact path. It also can't automate its way out of bad workforce discipline. Both matter.
The first lever is workforce management. Not as a reporting exercise, but as a daily control system.
Strong centers do a few basics well:
Teams looking to tighten that discipline can use a practical contact center scheduling and compliance guide as a framework for aligning coverage, adherence, and regulated workflows.
The second lever is technology design.
The best gains usually come from reducing unnecessary live contacts and shortening the path for the contacts that still need an agent. In regulated environments, this often means better routing, clearer authentication, and self-service that handles straightforward actions without forcing a call.
A few examples show what works:
The fastest way to improve service level isn't always adding agents. Often it's stopping simple work from reaching agents in the first place.
Leaders often miss one indirect driver. Message deliverability affects call volume.
If billing reminders, payment links, appointment prompts, or digital notices fail to reach people, they call. That adds unnecessary demand to voice queues. On the email side, a practical check like an email blacklist checker can help operations teams catch deliverability issues before failed outreach turns into avoidable inbound congestion.
That doesn't replace queue management. It supports it. In tightly regulated environments, every failed digital touch can create another expensive voice interaction.
Several common moves look productive but usually backfire:
Service level improves when leadership removes friction from the whole journey. Not when it just pressures agents to answer faster.
Service level starts causing damage when leadership treats it like the proof of a healthy operation.
I have seen centers hit the answer-time target and still create a worse business outcome. Cost climbs, occupancy falls, agents rush through required steps, and repeat contacts increase. In regulated environments, that is not a small miss. It can mean disclosure failures, weak documentation, payment handling errors, or delays on time-sensitive customer issues.
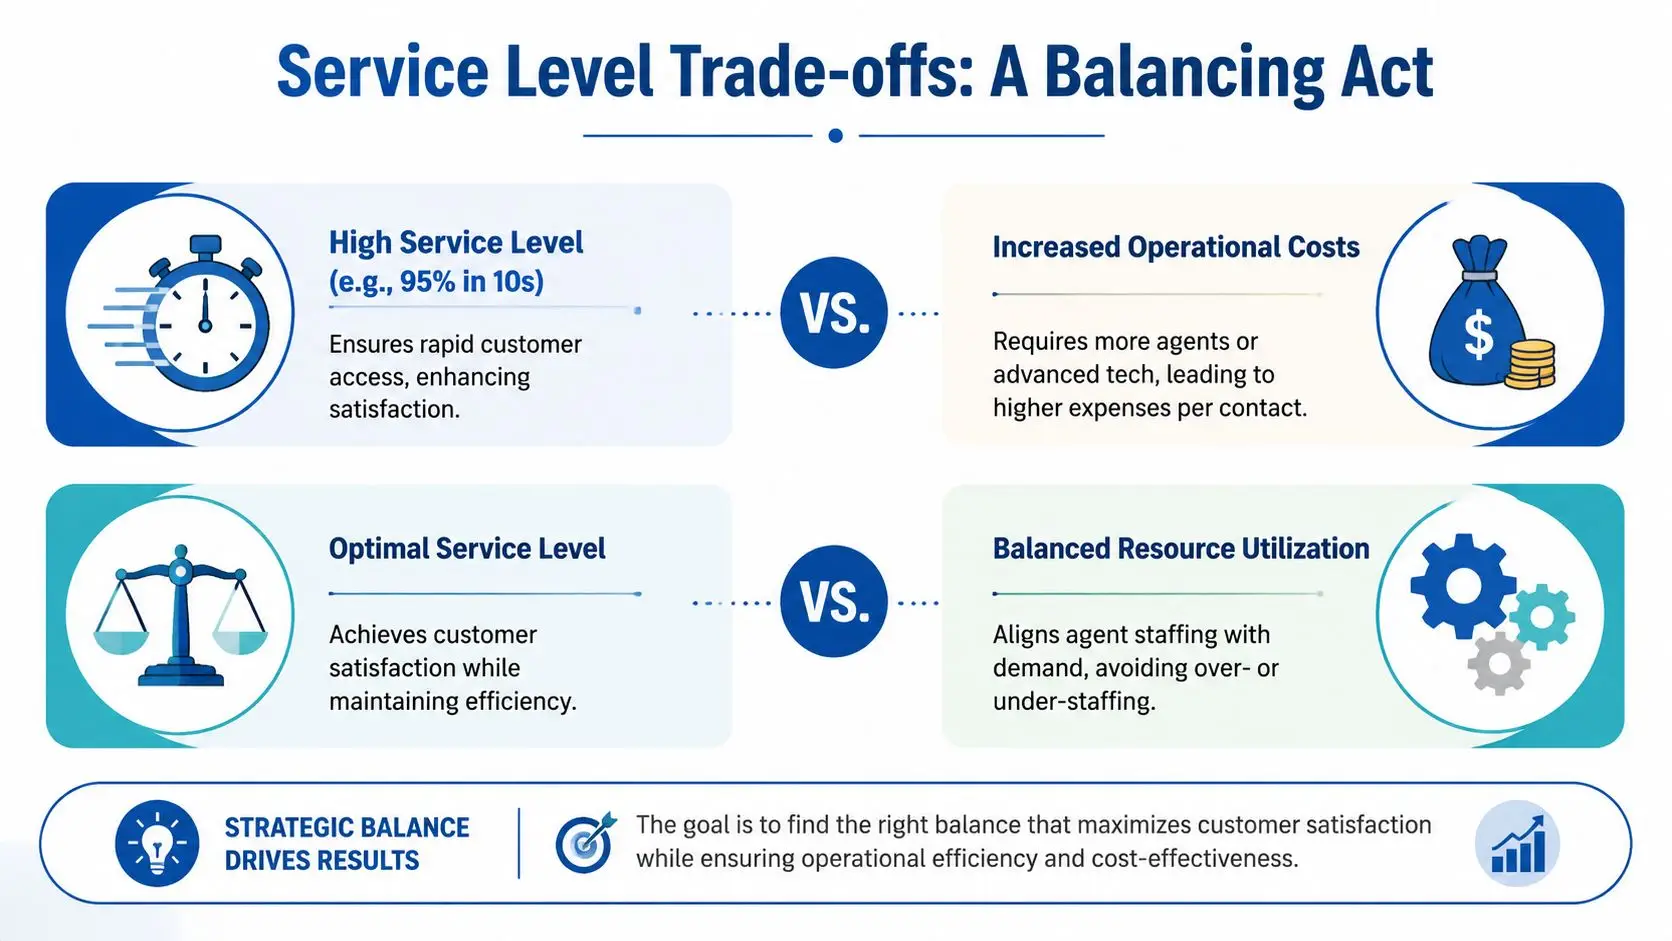
A higher service level usually comes from three places: more staffing, better routing, or less avoidable demand. All three can help. All three also have limits.
Add too much staffing and the center pays for idle time. Push agents to answer faster and they start shortening conversations in the wrong places. Improve routing without fixing the underlying queue design and you just move the wait somewhere else.
That tradeoff shows up quickly across the rest of the scorecard:
| KPI under pressure | What goes wrong when service level is over-prioritized |
|---|---|
| Occupancy | Too much slack gets built into the plan, raising cost without a matching gain in customer value |
| Labor cost | Coverage expands faster than demand justifies |
| AHT | Agents cut conversations short instead of resolving the issue correctly |
| FCR | Callbacks and repeat contacts rise because the first interaction was incomplete |
| QA and compliance | Required disclosures, verification steps, payment controls, and documentation quality start slipping |
That last line matters more than many teams admit. In healthcare, financial services, insurance, utilities, and collections, a missed step can cost far more than a longer hold time. A fast answer that creates remediation work is expensive service.
Longer waits usually increase abandonment. That relationship is obvious on the floor, even without chasing benchmark trivia. What matters operationally is finding the point where delay stops being manageable and starts creating lost demand, complaint risk, or repeat attempts into already stressed queues.
A retail support line can sometimes absorb that better than a medical scheduling queue or a collections line tied to a regulatory timeline. The missed contact is not equal across industries. That is why service level has to be judged against the business consequence of delay, not just against a generic benchmark.
Service level belongs in a balanced operating view, not on a pedestal by itself. Teams building that view can use this guide to contact center KPIs to set up a scorecard that shows cause and effect instead of isolated numbers.
Track the relationships that expose bad tradeoffs:
This only works if the underlying reporting is clean. A scorecard built on broken event tagging or inconsistent queue logic will send operations in the wrong direction. Teams that need to tighten that foundation should ensure data quality with Trackingplan.
The right service level target supports accessibility without buying speed at any price. Once the metric starts driving staffing bloat, weaker quality, or higher compliance exposure, it has stopped serving the operation. The center ends up paying twice. First in labor, then in rework.
Service level reporting goes wrong long before the monthly dashboard hits leadership. It usually breaks at the definition stage. If operations, WFM, QA, and compliance are not using the same queue logic, the same abandon rules, and the same interval view, the reported number stops being useful.
That is not a reporting nuisance. It is an operating risk.
A blended monthly average can make a weak operation look stable. One ugly lunch-hour block, one understaffed Monday morning, or one broken routing rule can disappear inside an acceptable monthly result. Customers still waited. Some abandoned. In regulated environments, some of those contacts were tied to disputes, payments, benefits, or disclosures that could not wait.
The fastest way to damage trust in service level reporting is to let each team calculate it differently. I have seen centers exclude short abandons without a written threshold, count transfers one way in one queue and another way elsewhere, and report against a target that no one can define the same way twice. Leadership sees a clean headline number. Frontline reality looks very different.
A disciplined reporting standard includes a few basics:
For teams tightening metric governance across platforms and workflows, it helps to ensure data quality with Trackingplan so event definitions and queue data do not drift over time.
In regulated contact centers, missed access is not just a CX problem. It can create real downstream exposure.
In collections, weak accessibility can increase complaint volume when consumers cannot quickly reach an agent to dispute a balance, clarify a notice, or make a payment arrangement. In healthcare revenue cycle, delayed access can interfere with time-sensitive billing and payment conversations inside HIPAA-controlled processes. In card payment environments, pressure to recover service level by rushing calls can lead agents to cut corners on PCI-DSS handling. In outbound or blended environments, poor queue design and backlog pressure can push teams toward bad contact practices that create TCPA risk.
This is why experienced operators do not chase 80/20 as a badge of honor. They choose a target that protects access where delay creates financial, legal, or customer harm, then they report that target in a way that holds up under scrutiny.
Accurate reporting should answer two questions. Did we answer fast enough, and did we stay in control while doing it?
A stronger reporting model usually includes:
Teams that need a tighter link between accessibility, accuracy, and agent behavior should use a contact center quality management approach that measures those outcomes together.
Treat service level as an audited operating metric. Define it clearly, report it at the right level, and test it against compliance and quality outcomes. That is how the metric earns its place in the business.